

This article is part of the folder : L'imagerie et les données satellitaires pour l'observation du territoire
See the 26 news related to this folder
The urban heat island (UHI) phenomenon is an increase in air temperature in the centre of a city compared to surrounding rural areas, and it can accentuate the negative impact of heatwaves in terms of outdoor thermal discomfort or even health risk, and building cooling load. During the 2003 heatwave, the temperature difference between the centre of Paris and the outskirts was 8 °C.
A method for planning stakeholders

Cerema has developed and tested a method for mapping urban heat islands (UHIs) as part of a thesis carried out by the University of Lorraine, and entitled "Characterisation of urban heat islands by climate zoning and mobile measurements: Case of Nancy". The method is being tested in the metropolitan areas of Lille and Clermont-Ferrand.
Based on research work, then transposed into an operational framework, this method is aimed at local authorities and planners, and more broadly at all the region's stakeholders. It aims to provide tools and indicators to better characterise and understand the phenomenon of UHIs, to target the associated issues, shed light on urban planning and guide future developments…
The urban heat island diagnostic tool is used to:
-
determine sensitive areas in order to set up a process to reduce heat islands,
-
take into account the configuration of the district for new development projects,
-
integrate thermal comfort in the design and development of urban spaces.
mapping local climatic zones and the challenges
Satellite or aerial imagery makes it possible to obtain maps of the city's surface temperatures. This requires switching from brightness temperatures to surface temperatures, considering the emissivity of the materials.
The urban heat island (UHI) mapping method is based on the concept of Local Climate Zones (LCZ). Urban islands are grouped into 17 classes corresponding to climatic zones and characterised by indicators linked to the morphology of streets and buildings, to nature and to land use.
Based on this classification, Cerema uses Pleiades images which have dual benefits:
-
with images delivered at 50 cm precision, urban objects can be more finely analysed
-
the Pléiades satellites provide stereoscopic images, processed by the IGN which supplies, on request from Cerema, a digital surface model (DSM). This DSM is used to enrich the initial LCZ classification by integrating new indicators associated with surface data (buildings, roads, vegetation…).
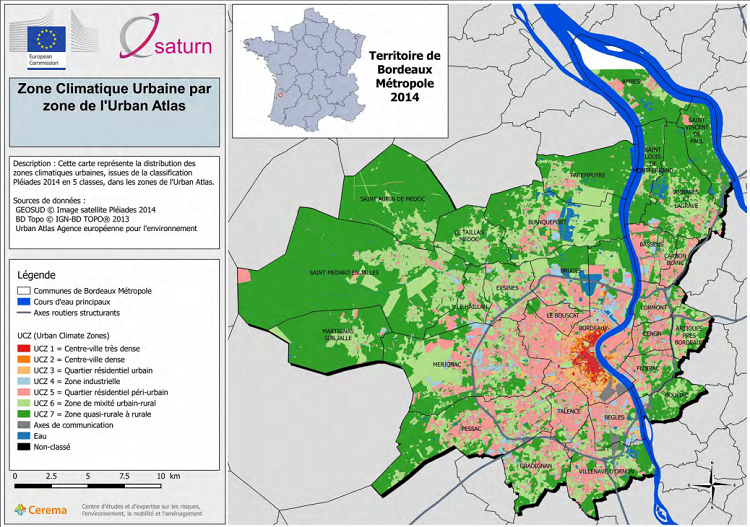
To obtain these new indicators, processing chains and artificial intelligence algorithms have been developed. Using exogenous databases (BD Topo from IGN, Urban Atlas used by Copernicus…) and a sample-based learning method, highly automated processing minimises human intervention.
The typology of urban climatic zones (17 classes) is more and more precise, particularly in geometrical terms (urban morphologies).
By combining the LCZ classification with automatic processing, Cerema is able to provide numerous analytical media: mapping of population vulnerability cross-referenced with the location of UHIs (cross-referencing between age groups estimated at risk and UHIs), energy vulnerability indicators associated with building age…
The results are relevant for large and medium-sized conurbations in mainland France. The maps produced are used to support planning and development documents (issuance of a planning / building permits, preparation of a Regional Planning, Sustainable Development and Equality Scheme (Schéma Régional d'Aménagement, de Développement Durable et d'Égalité des Territoires - SRADDET), etc.)
Advantages and limitations of the method
Advantages...
-
To perform a fine analysis of urban objects at the scale of a city, Pléiades images are well-suited: acquisition of a city in one pass, images sampled at 50 cm, stereoscopy…. For analysis at the regional scale however, it is better to use images from lower resolution satellites.
-
The LCZ classification is internationally recognised: this cartographic method enriched by satellite images is reproducible in many countries.
-
The Pleiades images processed by IGN can easily be superimposed on the Urban Atlas cartographic database. Coverage of all European cities of more than 50,000 inhabitants, free and easy to access, is available on the Copernicus website.
-
Following the conclusive experiments carried out in three French cities (Nancy, Lille and Bordeaux), this method of mapping UHIs can be easily duplicated in other large and medium-sized urban areas.
Limitations...
-
Creating algorithms from satellite images remains complex. Even though algorithms are evolving (refinement during experiments, computer calculating speed…), they must have a high sensitivity to adapt to heterogeneous shots (shadows cast by buildings, low illumination in winter, etc. ).
-
The development of an automated processing method for Pleiades images requires time for research and experimentation.
-
As with any interpretation of satellite images, the results must be supported throughout the value chain, from the geomatics specialist to the planner / developer. The aim is to avoid any fundamental misunderstanding of the data.
Cerema contact
Learn more
In the folder : L'imagerie et les données satellitaires pour l'observation du territoire